How Bristol Residents Rate Culture and Public Spaces: The 2024 Survey
Bristol’s 2024 resident survey recorded falling satisfaction with outdoor events and fewer weekly park visits. The figures also need careful reading.
Published
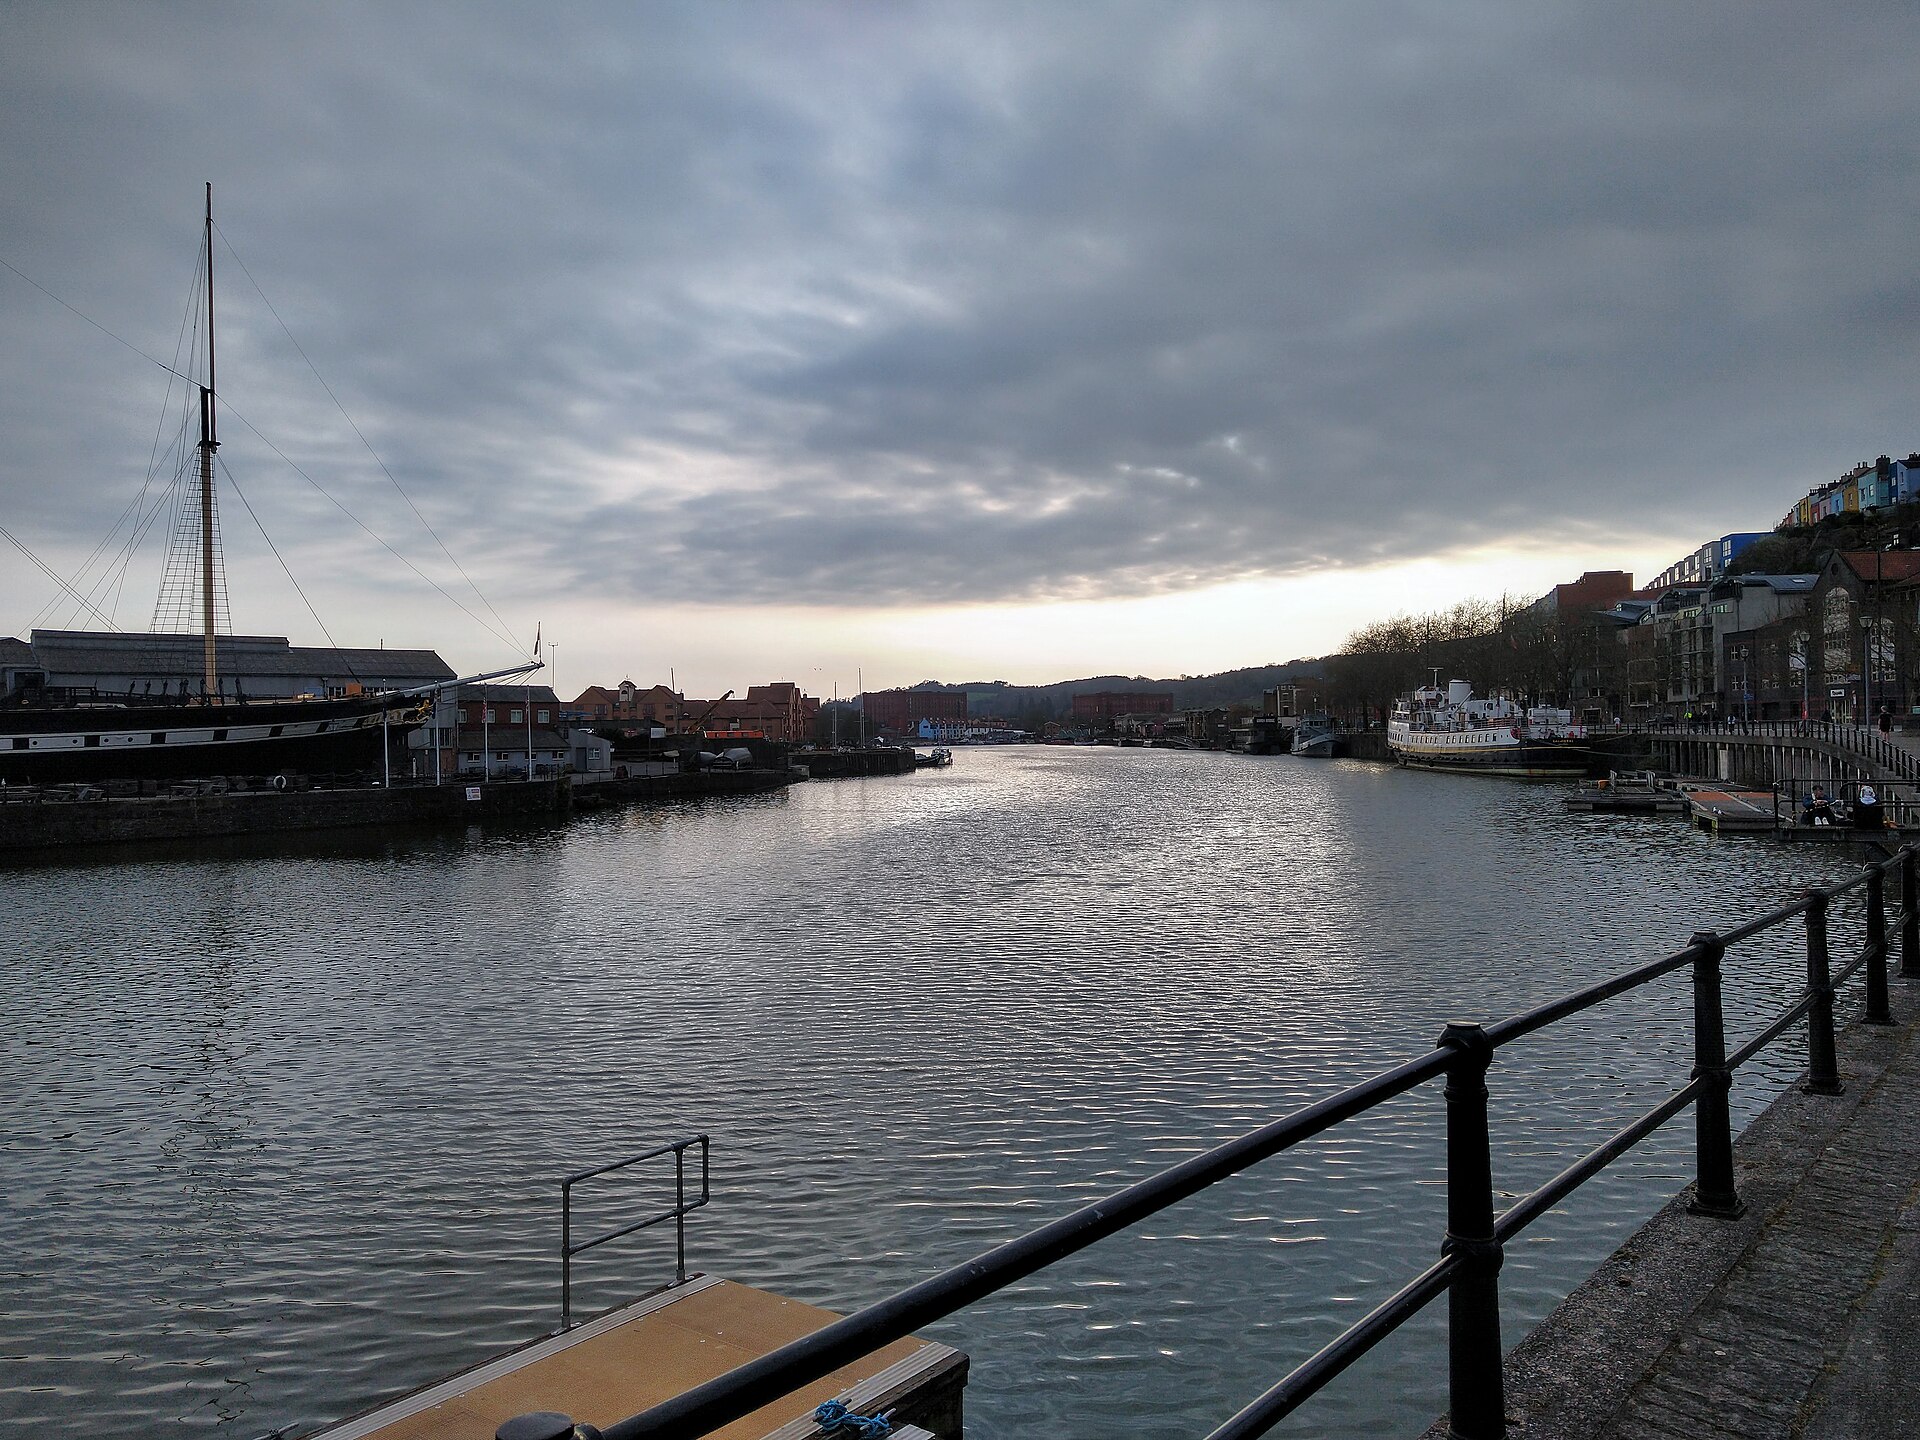

Bristol residents gave parks and outdoor events quite different assessments in the 2024 Quality of Life survey. Satisfaction with parks and green spaces stood at 70%, while satisfaction with the range and quality of outdoor events was 49%. Looking back to 2019, the change in outdoor-event satisfaction was much larger.[1]
Bristol City Council’s June 2025 final report calls this the 2024/25 survey, but the responses were collected in September and October 2024. These are residents’ reported experiences and opinions during that period. They provide evidence about participation and satisfaction, rather than an inspection score for individual parks, venues or events.[1]
Six Measures of Culture and Public Space
| Citywide survey indicator | 2019 | 2023 | 2024 | 2023 to 2024 change |
|---|---|---|---|---|
| Satisfied with the quality of parks and green spaces | 72% | 71% | 70% | −1 percentage point |
| Visit Bristol’s parks and green spaces at least weekly | 53% | 57% | 53% | −4 percentage points |
| Satisfied with the range and quality of outdoor events | 74% | 55% | 49% | −6 percentage points |
| Participate in cultural activities at least monthly | 43% | 37% | 36% | −1 percentage point |
| Satisfied with the range and quality of entertainment and hospitality venues and events at night | Not available | 64% | 61% | −3 percentage points |
| Satisfied with leisure facilities or services | 46% | 39% | 39% | 0 percentage points |
The table brings together six indicators from the report’s citywide priority summaries. Changes are calculated as the 2024 percentage minus the 2023 percentage, using the published whole-number figures. A percentage-point change describes the difference between two percentages. It does not describe a proportional change in attendance or satisfaction.[1]
Outdoor Events Show the Largest Long-Term Fall
Among these six measures, outdoor-event satisfaction recorded the largest fall between 2019 and 2024: from 74% to 49%, a difference of 25 percentage points. Over the same period, park satisfaction moved from 72% to 70%, a difference of two points. Treating both as one general decline in Bristol’s public spaces would obscure the scale of that difference.[1]
The outdoor-events question combines range and quality in one measure. Its result cannot tell us how much of the change concerned the choice of events and how much concerned their quality. Nor does the satisfaction figure establish that fewer events took place.[1]
Using a Space and Liking It Are Different Measures
Weekly park visiting fell from 57% in 2023 to 53% in 2024, returning to the percentage recorded in 2019. Park satisfaction changed by one point over the latest year. These questions capture different things: frequency of visits and an assessment of quality. The figures alone cannot explain why people visited less often.[1]
Cultural participation has its own threshold. The 36% result counts people taking part at least monthly. You cannot read the remaining share as people who never participate, because less frequent participation falls outside that monthly measure. Likewise, satisfaction with night-time venues and events measures an opinion, rather than the frequency of nights out.[1]
The Citywide Average Conceals Substantial Gaps
For residents in Bristol’s 10% most deprived areas, park satisfaction was 45% in 2024, compared with 70% citywide. Outdoor-event satisfaction was 36%, compared with 49% citywide. Using the report’s rounded figures, those differences were 25 and 13 percentage points respectively.[1]
The report defines this group by where households live, using the 2019 Index of Multiple Deprivation. It is an area-based comparison, so it should not be treated as an individual income classification. The citywide average also includes residents of those areas. These are overlapping populations, rather than two separate groups whose percentages can be added together.[1]
Who the Survey Represents
The survey targeted residents aged 16 and over within Bristol City Council’s boundaries. Invitations went to 33,000 randomly selected households, followed by a reminder offering a paper questionnaire and targeted promotion to improve participation among under-represented wards and groups. The final analysis used 4,106 responses meeting the sample criteria.[1]
Results were weighted by ward, age and sex to adjust the sample towards the population. Coverage still matters. Student halls were excluded from the sampling frame, and younger people remained under-represented among respondents. Weighting adjusts the contribution of responses, but it cannot supply the experiences of people who did not respond.[1]
Keep the population denominator separate too. The council’s population overview describes the Bristol local authority area and estimates 495,300 residents of all ages at mid-2025. That is a later observation covering a wider age range than this survey. Multiplying a 2024 survey percentage by that population total would mix years and populations.[1][2]
Which Changes Deserve Caution?
The report uses statistical tests to distinguish some changes from sampling variation, with thresholds varying between indicators because response levels differ. It explicitly describes the three-point fall in satisfaction with night-time entertainment as statistically significant. A one-point movement elsewhere should not automatically receive the same interpretation.[1]
For a local discussion about an event programme or park improvement, start with the matching question: satisfaction, participation or frequency of use. Then check the relevant ward or group result and its statistical comparison in the council’s Quality of Life dashboard. The citywide figures establish useful questions, while leaving the reasons behind several changes unresolved.[1]
Sources and checks
These sources were used for this article. Availability, prices and service details can change after the stated check date.
- https://www.bristol.gov.uk/files/documents/9607-quality-of-life-2024-to-25-final-report
Checked 20 October 2026.
The citywide priority tables give the six selected indicators’ 2019, 2023 and 2024 percentages, with no 2019 comparator for night-time entertainment satisfaction. The article’s annual changes subtract the published rounded 2023 percentage from the published rounded 2024 percentage. Outdoor-event satisfaction fell by 25 percentage points between 2019 and 2024, compared with a two-point fall in park satisfaction. The June 2025 final report concerns September–October 2024 fieldwork among residents aged 16 and over within Bristol City Council boundaries. The report records 33,000 randomly selected household invitations, reminder and targeted recruitment phases, and 4,106 usable responses. The methodology weights results by ward, age and sex, excludes student halls, and records continuing under-representation of younger respondents. The deprivation summary gives 2024 park satisfaction of 45% and outdoor-event satisfaction of 36% in Bristol’s 10% most deprived areas, defined using the 2019 Index of Multiple Deprivation. The report uses statistical tests with thresholds varying by indicator and explicitly identifies the three-point fall in night-time entertainment satisfaction as statistically significant. The dashboard provides ward and demographic results alongside statistical comparisons.
- Population of Bristol
Checked 20 October 2026.
The population overview concerns the Bristol local authority area. The page reports an estimated total population of 495,300 at mid-2025, a different year and age coverage from the 2024 survey of residents aged 16 and over.