Bristol Population Change: The Mid-2025 Estimate And Its Boundaries
Bristol’s provisional mid-2025 population estimate is 495,260. Here’s how to read its age profile, the council’s decade comparison and the separate census and neighbourhood figures.
Published
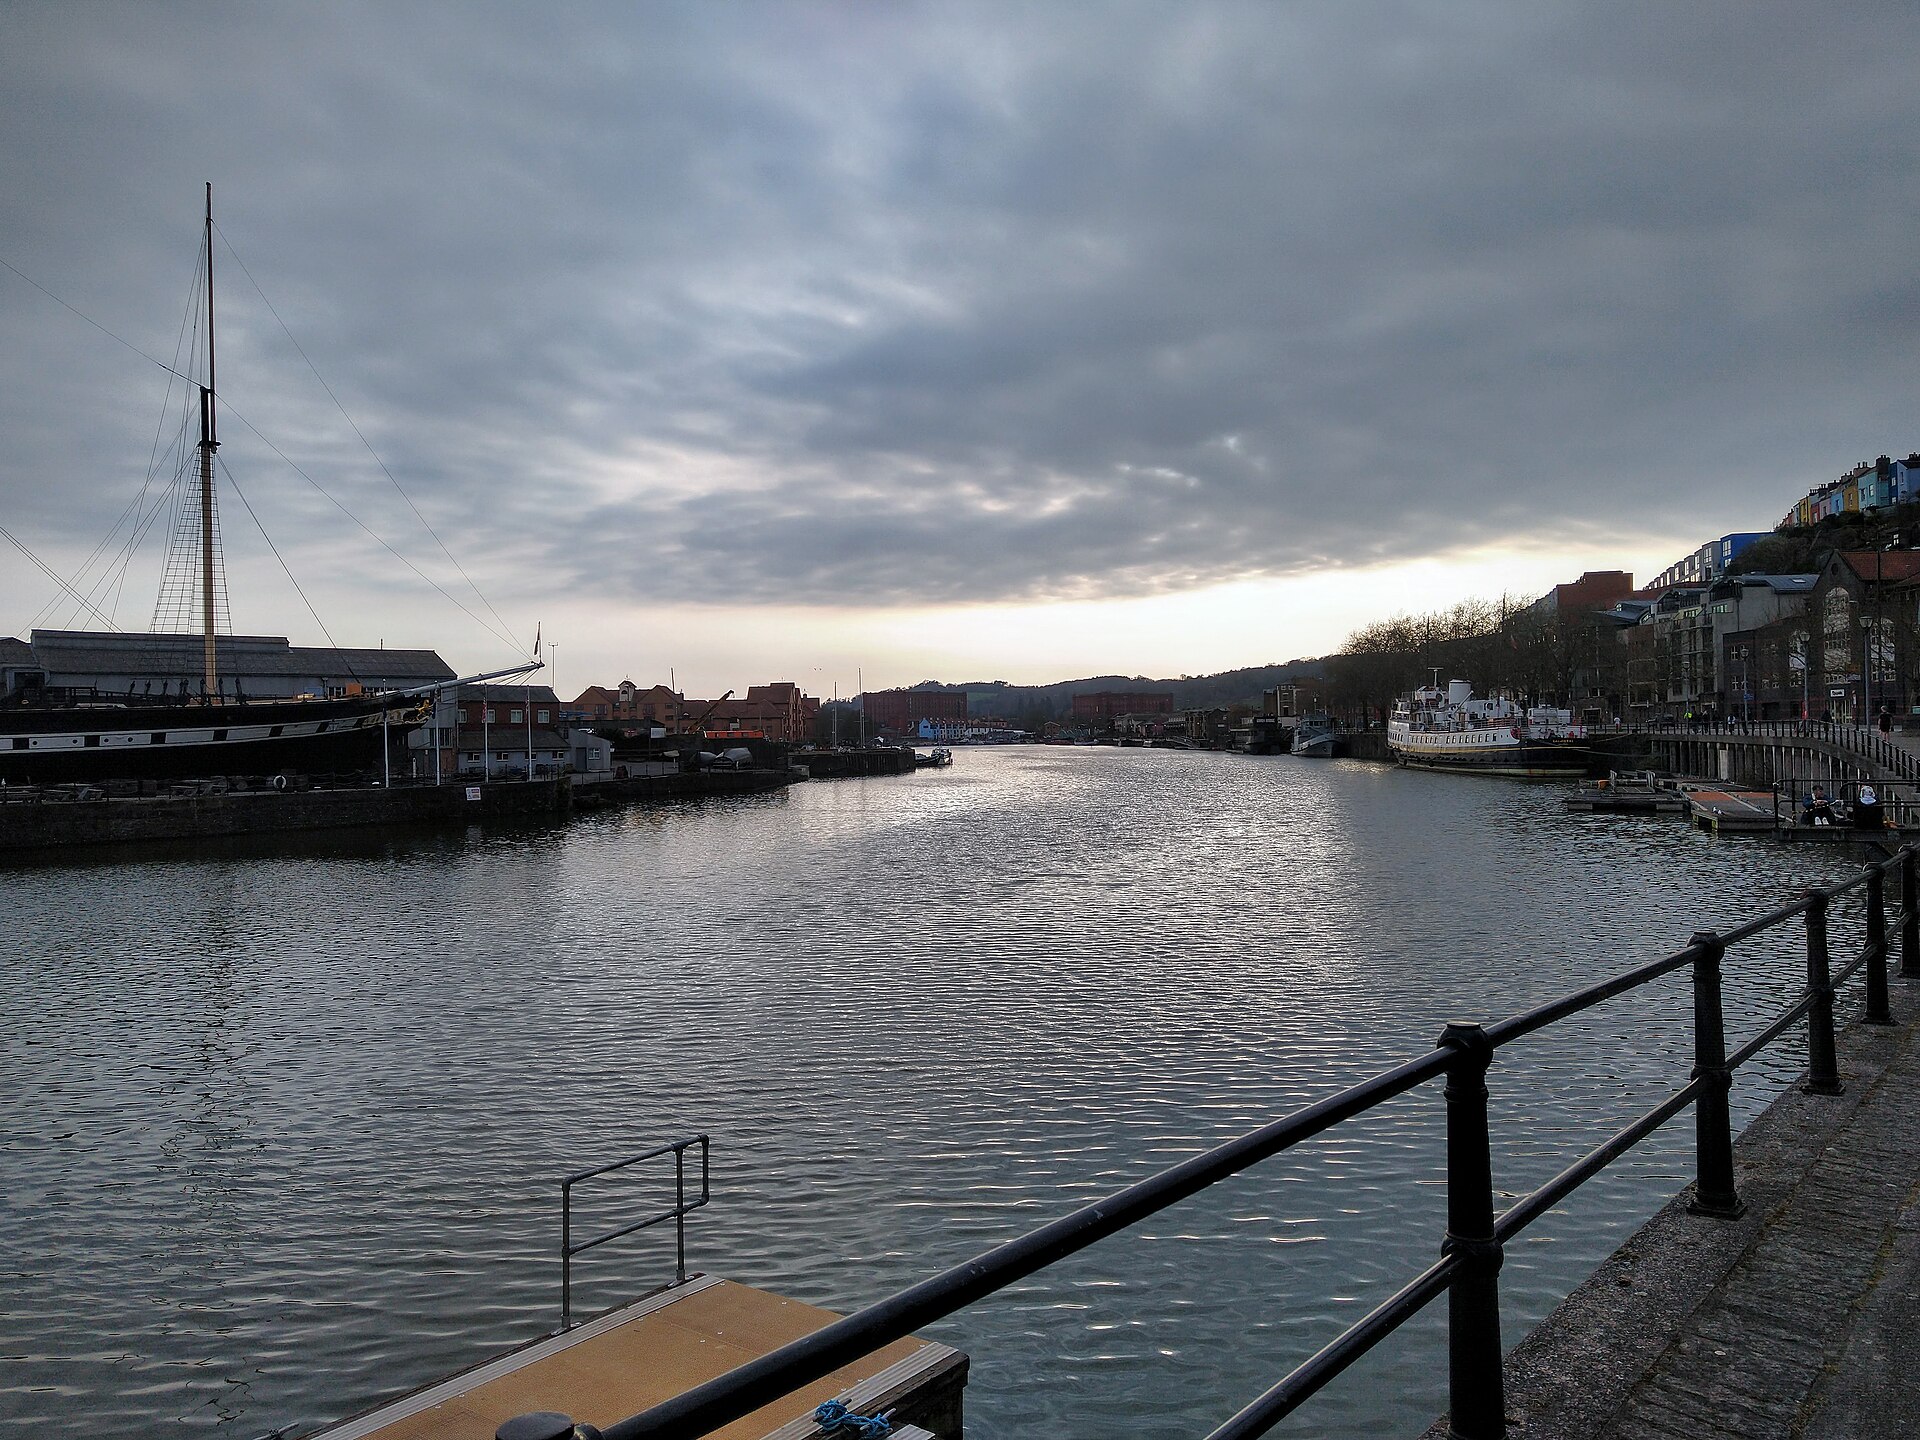

Bristol’s population was provisionally estimated at 495,260 in mid-2025, according to the Office for National Statistics figures published by Bristol City Council. The council’s population page rounds that to 495,300. Both describe the Bristol local authority area, and the provisional estimate remains subject to change.[1][3]
Which Bristol Does The Estimate Describe?
The boundary matters before any comparison begins. The council identifies its population figures as covering the Bristol local authority area. In the official Census 2021 records, that geography appears as “Bristol, City of”, with the code E06000023. Use that name and code when selecting a census comparison.[3][4]
A figure labelled Bristol can only answer your question if its boundary matches the area you mean. For this estimate, keep the description as Bristol local authority. Treat a city-centre population or a wider regional total as a separate measure requiring its own geographical definition.[1][3]
Bristol’s Mid-2025 Age Profile
People aged 25 to 49 make up the largest of the five broad age groups in the council’s table, with 196,276 residents. The following comparison uses those broad groups, which together account for the full provisional mid-2025 estimate.[1]
| Age Group | Bristol Residents, Mid-2025 | Calculated Share Of Bristol Total |
|---|---|---|
| 0 to 15 | 78,961 | 15.9% |
| 16 to 24 | 85,782 | 17.3% |
| 25 to 49 | 196,276 | 39.6% |
| 50 to 64 | 71,185 | 14.4% |
| 65 and over | 63,056 | 12.7% |
| All ages | 495,260 | 100.0% |
Each age-group share is calculated as the group’s population divided by 495,260, multiplied by 100 and rounded to one decimal place. The five counts sum to the all-age total. Rounding means the displayed group percentages needn’t add to exactly 100%.[1]
The England and Wales comparison gives the age profile more meaning. In the council’s broad-band table, 16 to 24-year-olds account for 17.3% of Bristol’s mid-2025 population, against 10.7% across England and Wales. For residents aged 65 and over, the corresponding shares are 12.7% and 19.3%. Those comparisons describe age composition. They don’t establish why the populations differ.[1]
What The Council Says About Population Change
For 2015 to 2025, Bristol City Council reports an estimated population increase of 43,500 people, or 9.6%, within the Bristol local authority area. Its comparison for England and Wales over the same period is 7.1%. These are the council’s published decade figures.[3]
Keep that ten-year window attached to the numbers when quoting them. The 9.6% describes the whole period from 2015 to 2025. It doesn’t describe a single year, and dividing it into equal annual portions would impose a pattern that the headline comparison doesn’t show.[3]
Where Census 2021 Fits
The official Census 2021 table records 472,465 usual residents in Bristol, City of, on Census Day, 21 March 2021. That is an earlier observation with a different reference date from the provisional mid-2025 estimate. Keep the census label and its reference date together when using the figure.[4][2][1]
Census table TS001 separates usual residents living in households from those living in communal establishments. Its total covers both categories. If you want the full Bristol census population, select “Total: All usual residents” rather than one residence category. Nomis, the official statistics service carrying the table, also explains that disclosure protection can produce small differences between census tables.[2][4]
Neighbourhood Figures Have A Different Reference Year
The council’s population page pairs the city’s mid-2025 estimate with ward and Lower Layer Super Output Area tables for mid-2024. Those smaller-area figures retain their own observation year. A ward figure taken from those tables should be labelled mid-2024 even when it appears beside the newer city total.[3]
Before using a population number in a neighbourhood discussion, check its area, reference year and whether it is a census count or an estimate. For Bristol, that means keeping the provisional mid-2025 authority total distinct from the mid-2024 small-area tables and the Census Day 2021 records.[1][3][2]
Sources and checks
These sources were used for this article. Availability, prices and service details can change after the stated check date.
- https://www.bristol.gov.uk/files/documents/11313-mid-2025-population-estimates-by-age-and-sex
Checked 20 October 2026.
The Bristol local authority provisional mid-2025 population estimate is 495,260 and is subject to change. The five broad age groups contain 78,961, 85,782, 196,276, 71,185 and 63,056 residents respectively. The broad age-group counts sum to 495,260. The article calculates age-group shares using each count divided by 495,260, multiplied by 100 and rounded to one decimal place. The table reports mid-2025 shares of 17.3% in Bristol and 10.7% in England and Wales for ages 16 to 24, and 12.7% and 19.3% respectively for ages 65 and over.
- TS001 - Number of usual residents in households and communal establishments - Nomis - Official Census and Labour Market Statistics
Checked 20 October 2026.
TS001 classifies usual residents by residence in households or communal establishments. The census reference date is 21 March 2021. Statistical disclosure control can cause small differences between census tables.
- Population of Bristol
Checked 20 October 2026.
The council describes the population geography as the Bristol local authority area. The council reports the rounded mid-2025 estimate as 495,300. The council reports estimated Bristol population growth of 43,500 people or 9.6% between 2015 and 2025, compared with 7.1% for England and Wales. The council labels its linked ward and LSOA population tables mid-2024, separately from the authority-level mid-2025 estimate.
- TS001
Checked 20 October 2026.
The Census 2021 geography Bristol, City of has code E06000023. The total usual-resident population in that geography is 472,465. The selected total includes usual residents in households and communal establishments.